Analysis Idea
Memory leak refers to the phenomenon where some objects are no longer in use in the Android process, but are referenced by some longer-lived objects, causing the occupied memory resources to fail to be recycled by GC, and memory usage continues to increase. Memory leaks are a common factor leading to decreased performance and lag in our applications. The core ideas for solving such problems can be summarized in two steps:
- Simulate memory leak operations, observe changes in the application Heap memory, and determine the approximate location of the problem;
- Expand the analysis for the specific location, find the complete reference chain from the leaked object to the GC Root, and fix the memory leak from the source.
Analysis Tool: Android Studio Profiler
The commonly used memory analysis tools in Profiler are two: Memory Chart and Heap Dump. The memory curve can observe the memory usage status in real time to assist us in performing dynamic memory analysis.
A typical phenomenon of memory leaks in the memory curve is a ladder-like shape. Once it rises, it becomes difficult to decrease. For example, after an Activity leak, repeatedly opening and closing the page, the memory usage will keep rising, and after clicking the trash can icon to manually GC, the usage cannot decrease to the level before opening the Activity. At this point, it is highly likely that a memory leak has occurred.
At this time, we can manually dump the memory distribution in the application heap at that moment for static analysis:
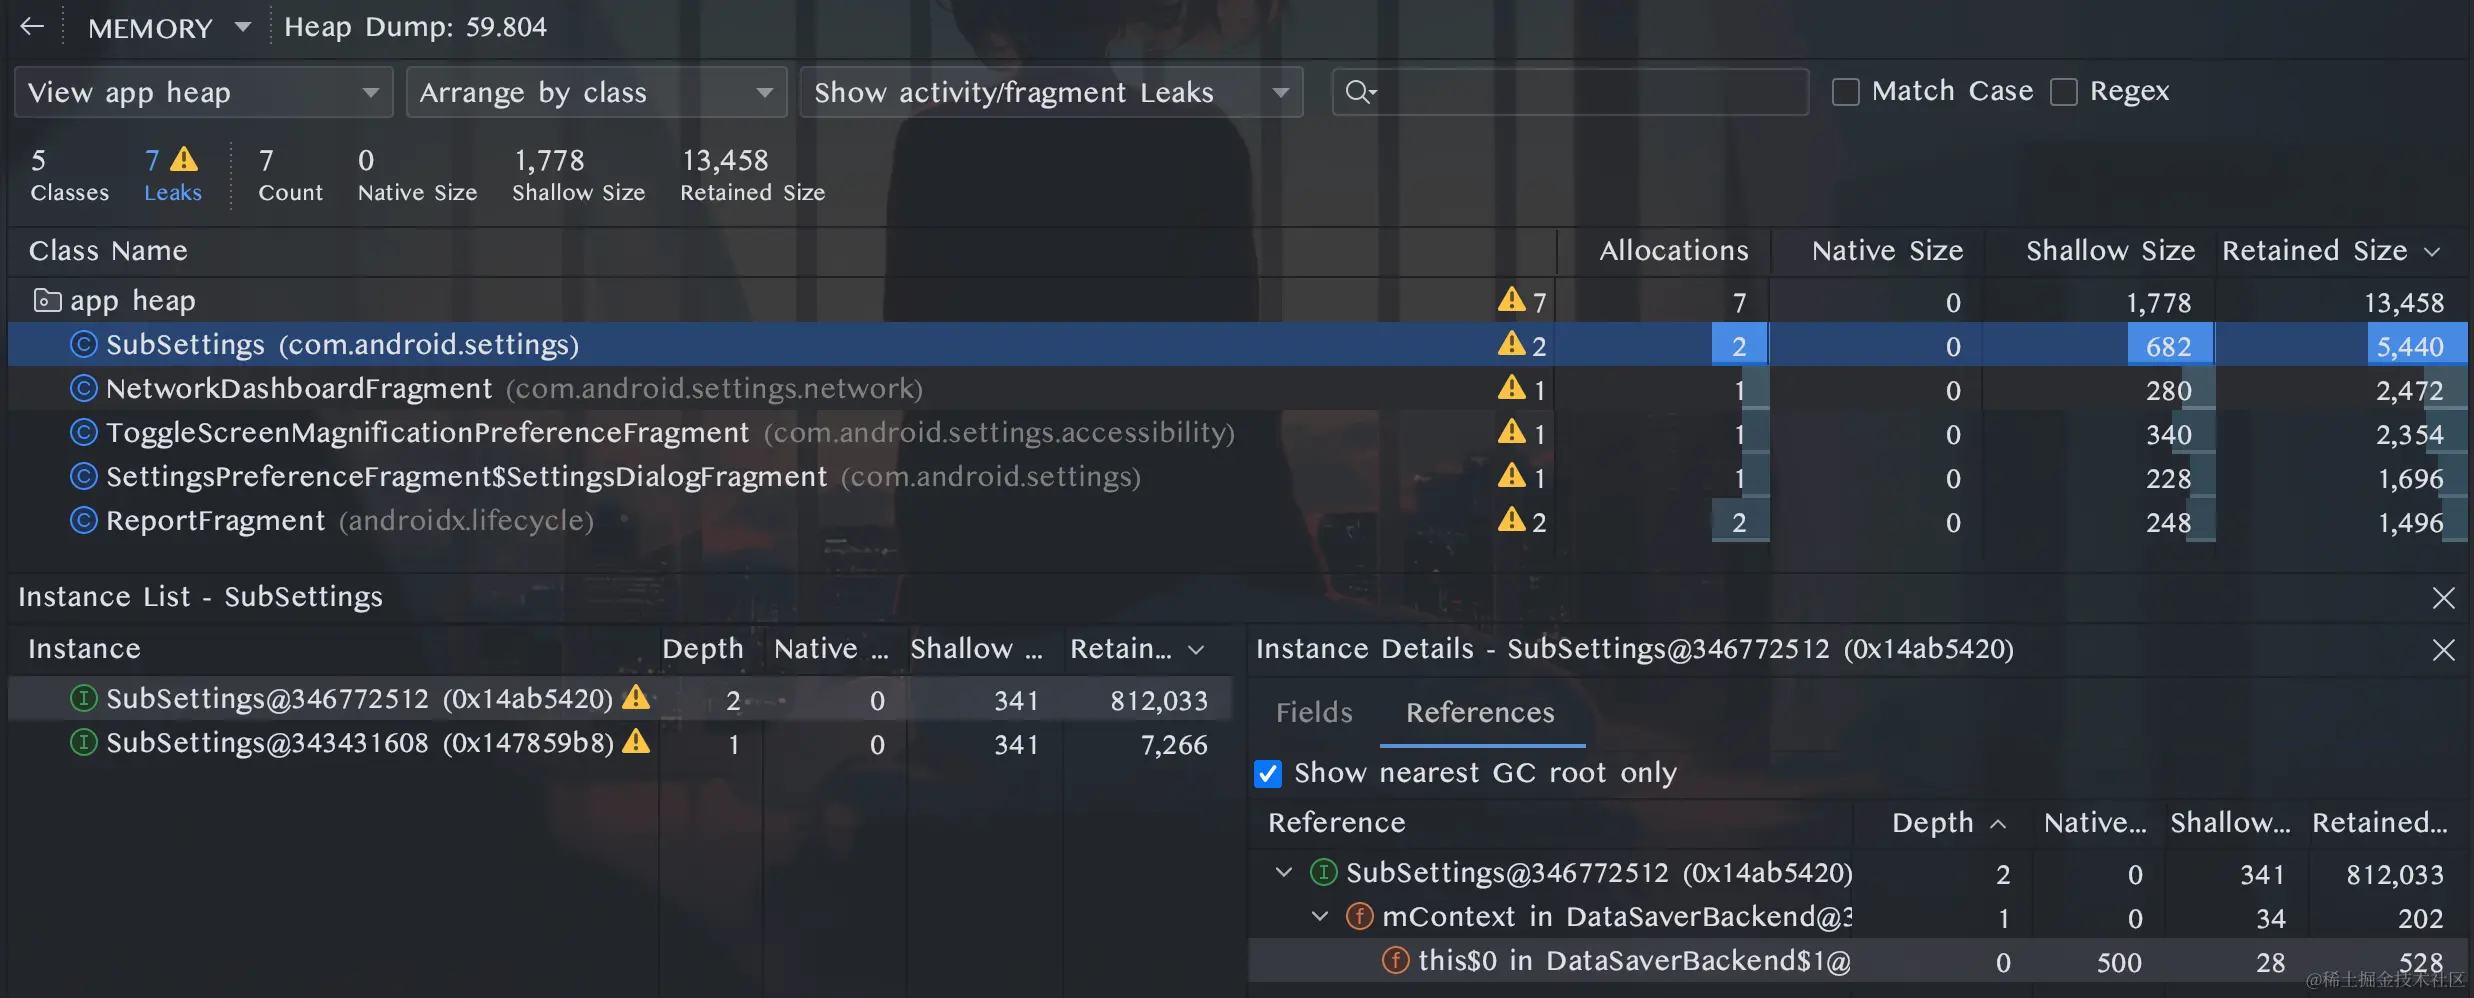
UI indicator descriptions:
Allocations: Number of instances of this class in the heap;Native Size: Memory occupied by native objects referenced by all instances of this class;Shallow Size: Actual memory footprint of all instances of this class itself, excluding memory footprint of objects it references;Retained Size: Different fromShallow Size, this number represents the memory footprint of all instances of this class and all objects referenced by them;
The following diagram can give a more intuitive impression of these attributes:
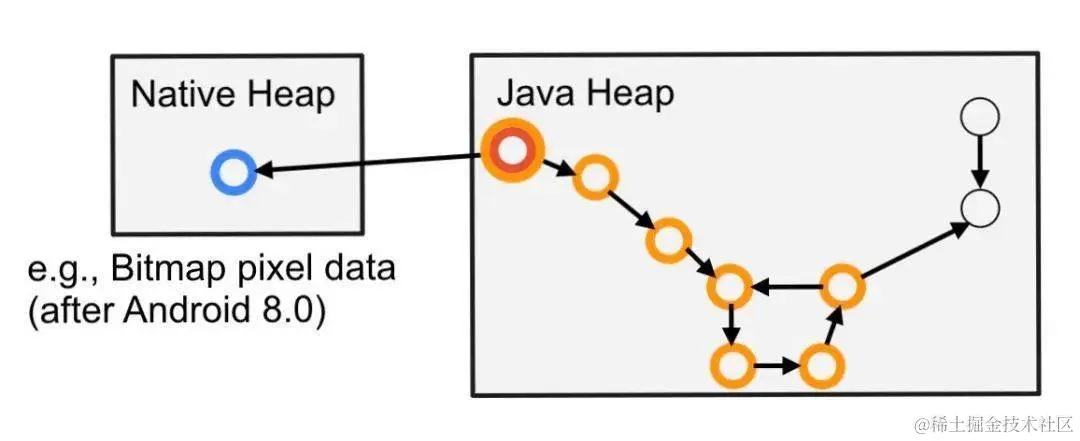
As shown in the figure above, the memory size represented by the red dots is the Shallow Size, the blue dots are the Native Size, and the memory size of all the orange dots is the Retained Size. When a memory leak occurs, we should pay more attention to the Retained Size number, which means the amount of wasted memory in the Java heap due to memory leaks. This is because memory leaks often have a "chain effect". Starting from the leaked object, all objects and native resources referenced by that object cannot be collected, resulting in reduced memory usage efficiency.
In addition, Leaks represents the possible number of memory leak instances. Clicking on the class in the list allows you to view the instance details of that class. The depth in the Instance list represents the shortest call chain depth from that instance to GC Root. You can visually see the complete call chain in the Reference stack on the right side of Figure 1. You can then trace back along the chain to find the most suspicious reference, analyze the cause of the leak combined with code analysis, and treat it accordingly to solve the problem.
Next, let's analyze some typical memory leak cases we have encountered in projects:
Case Analysis
Case 1: BitmapBinder memory leak
When dealing with scenarios involving inter-process Bitmap transfer, we adopted a BitmapBinder method. Because Intent supports passing custom Binder, we can use Binder to implement Bitmap object transfer via Intent:
// IBitmapBinder AIDL file
import android.graphics.Bitmap;
interface IBitmapInterface {
    Bitmap getIntentBitmap();
}
However, after Activity1 uses BitmapBinder to pass Bitmap to Activity2, two serious memory leak problems occurred:
- Failure to recycle when returning after jumping;
BitmapandBinderobjects are repeatedly created and cannot be recycled;
Let's first analyze the Heap Dump:
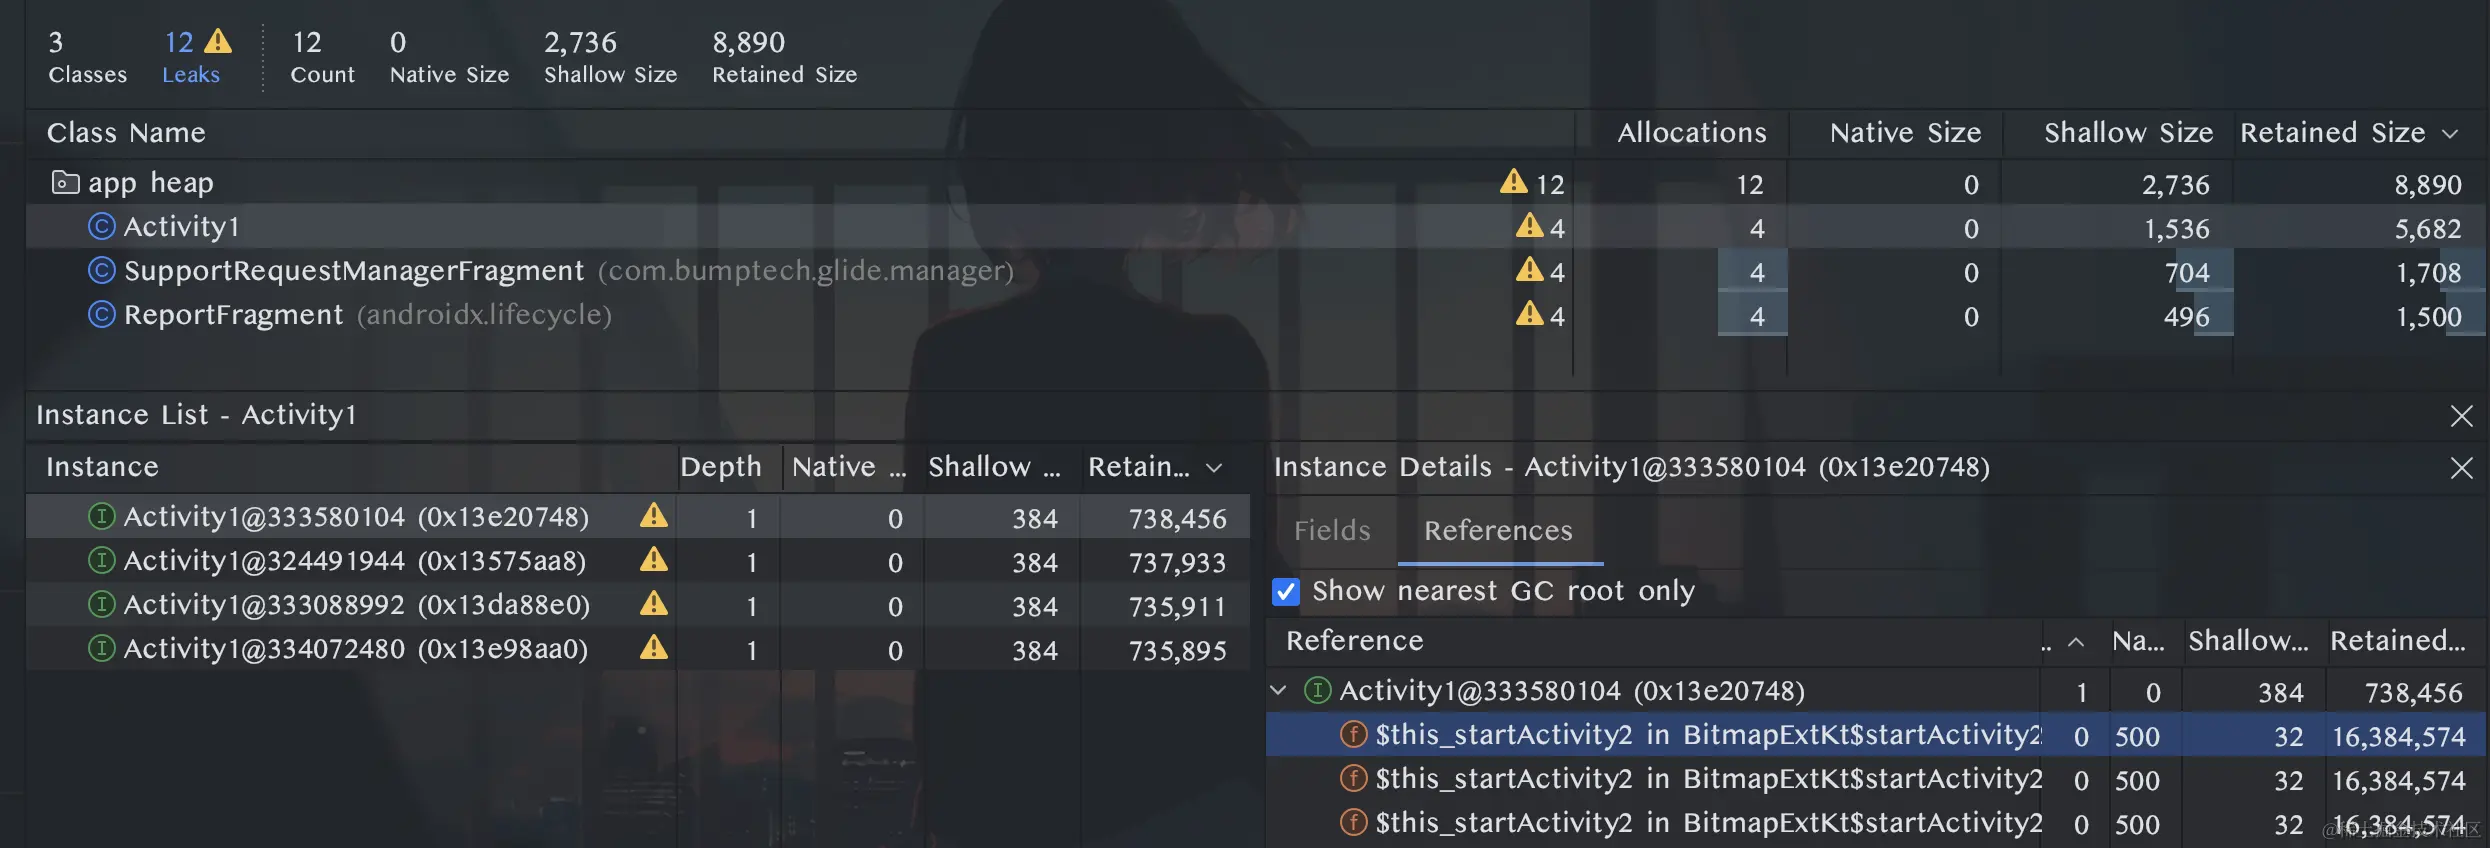
This is a "multi-instance" memory leak, that is, each time Activity1 is finished and reopened, an Activity object is added to the Heap and cannot be destroyed. It is common in scenarios such as inner class references and static array references (such as listener lists). According to the reference chain provided by Profiler, we found the BitmapExt class:
suspend fun Activity.startActivity2WithBitmap() {
    val screenShotBitmap = withContext(Dispatchers.IO) {
        SDKDeviceHelper.screenShot()
    } ?: return
    startActivity(Intent().apply {
        val bundle = Bundle()
        bundle.putBinder(KEY_SCREENSHOT_BINDER, object : IBitmapInterface.Stub() {
            override fun getIntentBitmap(): Bitmap {
                return screenShotBitmap
            }
        })
        putExtra(INTENT_QUESTION_SCREENSHOT_BITMAP, bundle)
    })
}
BitmapExt has a global extension method for Activity called startActivity2WithBitmap. It creates a Binder inside, throws the obtained screenshot Bitmap in, and sends it to Activity2 in an Intent. Obviously there is an anonymous inner class of IBitmapInterface here. It looks like the leak originated here.
But there are two questions. First, isn't this inner class written in the method, so when the method ends, won't the reference to the inner class in the method stack be cleared? Second, this inner class does not even reference Activity, right?
To figure this out, we need to decompile the Kotlin code into Java to see:
@Nullable
public static final Object startActivity2WithBitmap(@NotNull Activity $this$startActivity2WithBitmap, boolean var1, @NotNull Continuation var2) {
    ...
    Bitmap var14 = (Bitmap)var10000;
    if (var14 == null) {
        return Unit.INSTANCE;
    } else {
        Bitmap screenShotBitmap = var14;
        Intent var4 = new Intent();
        int var6 = false;
        Bundle bundle = new Bundle();
        // Inner class creation location:
        bundle.putBinder("screenShotBinder", (IBinder)(new BitmapExtKt$startActivity2WithBitmap$$inlined$apply$lambda$1($this$startActivity2WithBitmap, screenShotBitmap)));
        var4.putExtra("question_screenshot_bitmap", bundle);
        Unit var9 = Unit.INSTANCE;
        $this$startActivity2WithBitmap.startActivity(var4);
        return Unit.INSTANCE;
    }
}

// This is a normal class automatically generated by the kotlin compiler:
public final class BitmapExtKt$startActivity2WithBitmap$$inlined$apply$lambda$1 extends IBitmapInterface.Stub {
    // $FF: synthetic field
    final Activity $this_startActivity2WithBitmap$inlined; // References activity
    // $FF: synthetic field
    final Bitmap $screenShotBitmap$inlined;

    BitmapExtKt$startActivity2WithBitmap$$inlined$apply$lambda$1(Activity var1, Bitmap var2) {
        this.$this_startActivity2WithBitmap$inlined = var1;
        this.$screenShotBitmap$inlined = var2;
    }

    @NotNull
    public Bitmap getIntentBitmap() {
        return this.$screenShotBitmap$inlined;
    }
}
In the Java file generated by the Kotlin Compiler compilation, the anonymous inner class of IBitmapInterface is replaced with a normal class BitmapExtKt$startActivity2WithBitmap$$inlined$apply$lambda$1, which holds the Activity. This happens because Kotlin, in order to be able to use variables inside the method normally within the class, writes all variables created above the inner class code into member variables of the class. As a result, Activity is referenced by the class. In addition, the lifecycle of Binder itself is longer than that of Activity, so memory leaks occur.
The solution is to simply declare a normal class to bypass Kotlin Compiler "optimization" and remove the reference to Activity.
class BitmapBinder(private val bitmap: Bitmap): IBitmapInterface.Stub() {
    override fun getIntentBitmap() = bitmap
}

// Usage:
bundle.putBinder(KEY_SCREENSHOT_BINDER, BitmapBinder(screenShotBitmap))
Next, there is the problem that Bitmap and Binder are repeatedly created and cannot be recycled. The memory phenomenon is as shown. Each time you jump and close, the memory will rise a little, like a ladder. It cannot be released after GC.

In the heap, judging from the Bitmap size of "2560x1600, 320density", these are the screenshot Bitmap objects that failed to be recycled, held by Binder. But looking at the reference chain of Binder, no application-related references were found.

We speculated that Binder was referenced by longer-lived Native layer objects related to Binder implementation, but did not find an effective way to recycle Binder.
One solution is to reuse Binder to ensure Binder is not recreated each time Activity2 is opened. In addition, change BitmapBinder's Bitmap to a weak reference, so that even if Binder cannot be recycled, Bitmap can still be recycled in time. After all, Bitmap is the memory hog.
object BitmapBinderHolder {
    private var mBinder: BitmapBinder? = null // Ensure there is only one global BitmapBinder

    fun of(bitmap: Bitmap): BitmapBinder {
        return mBinder ?: BitmapBinder(WeakReference(bitmap)).apply { mBinder = this }
    }
}

class BitmapBinder(var bitmapRef: WeakReference<Bitmap>?): IBitmapInterface.Stub() {
    override fun getIntentBitmap() = bitmapRef?.get()
}

// Usage:
bundle.putBinder(KEY_SCREENSHOT_BINDER, BitmapBinderHolder.of(screenShotBitmap))
Verification: As shown in the memory graph, all Bitmaps created can be recycled normally after one GC.

Case 2: Flutter multi-engine scenario plugin memory leak
Many projects use a multi-engine solution to implement Flutter hybrid development. When closing a Flutter page, in order to avoid memory leaks, not only FlutterView, FlutterEngine, MessageChannel and other related components need to be unbound and destroyed in time, but also pay attention to whether each Flutter plugin has normal release operations.
For example, in one of our multi-engine projects, by repeatedly opening and closing a page, we found a memory leak point:
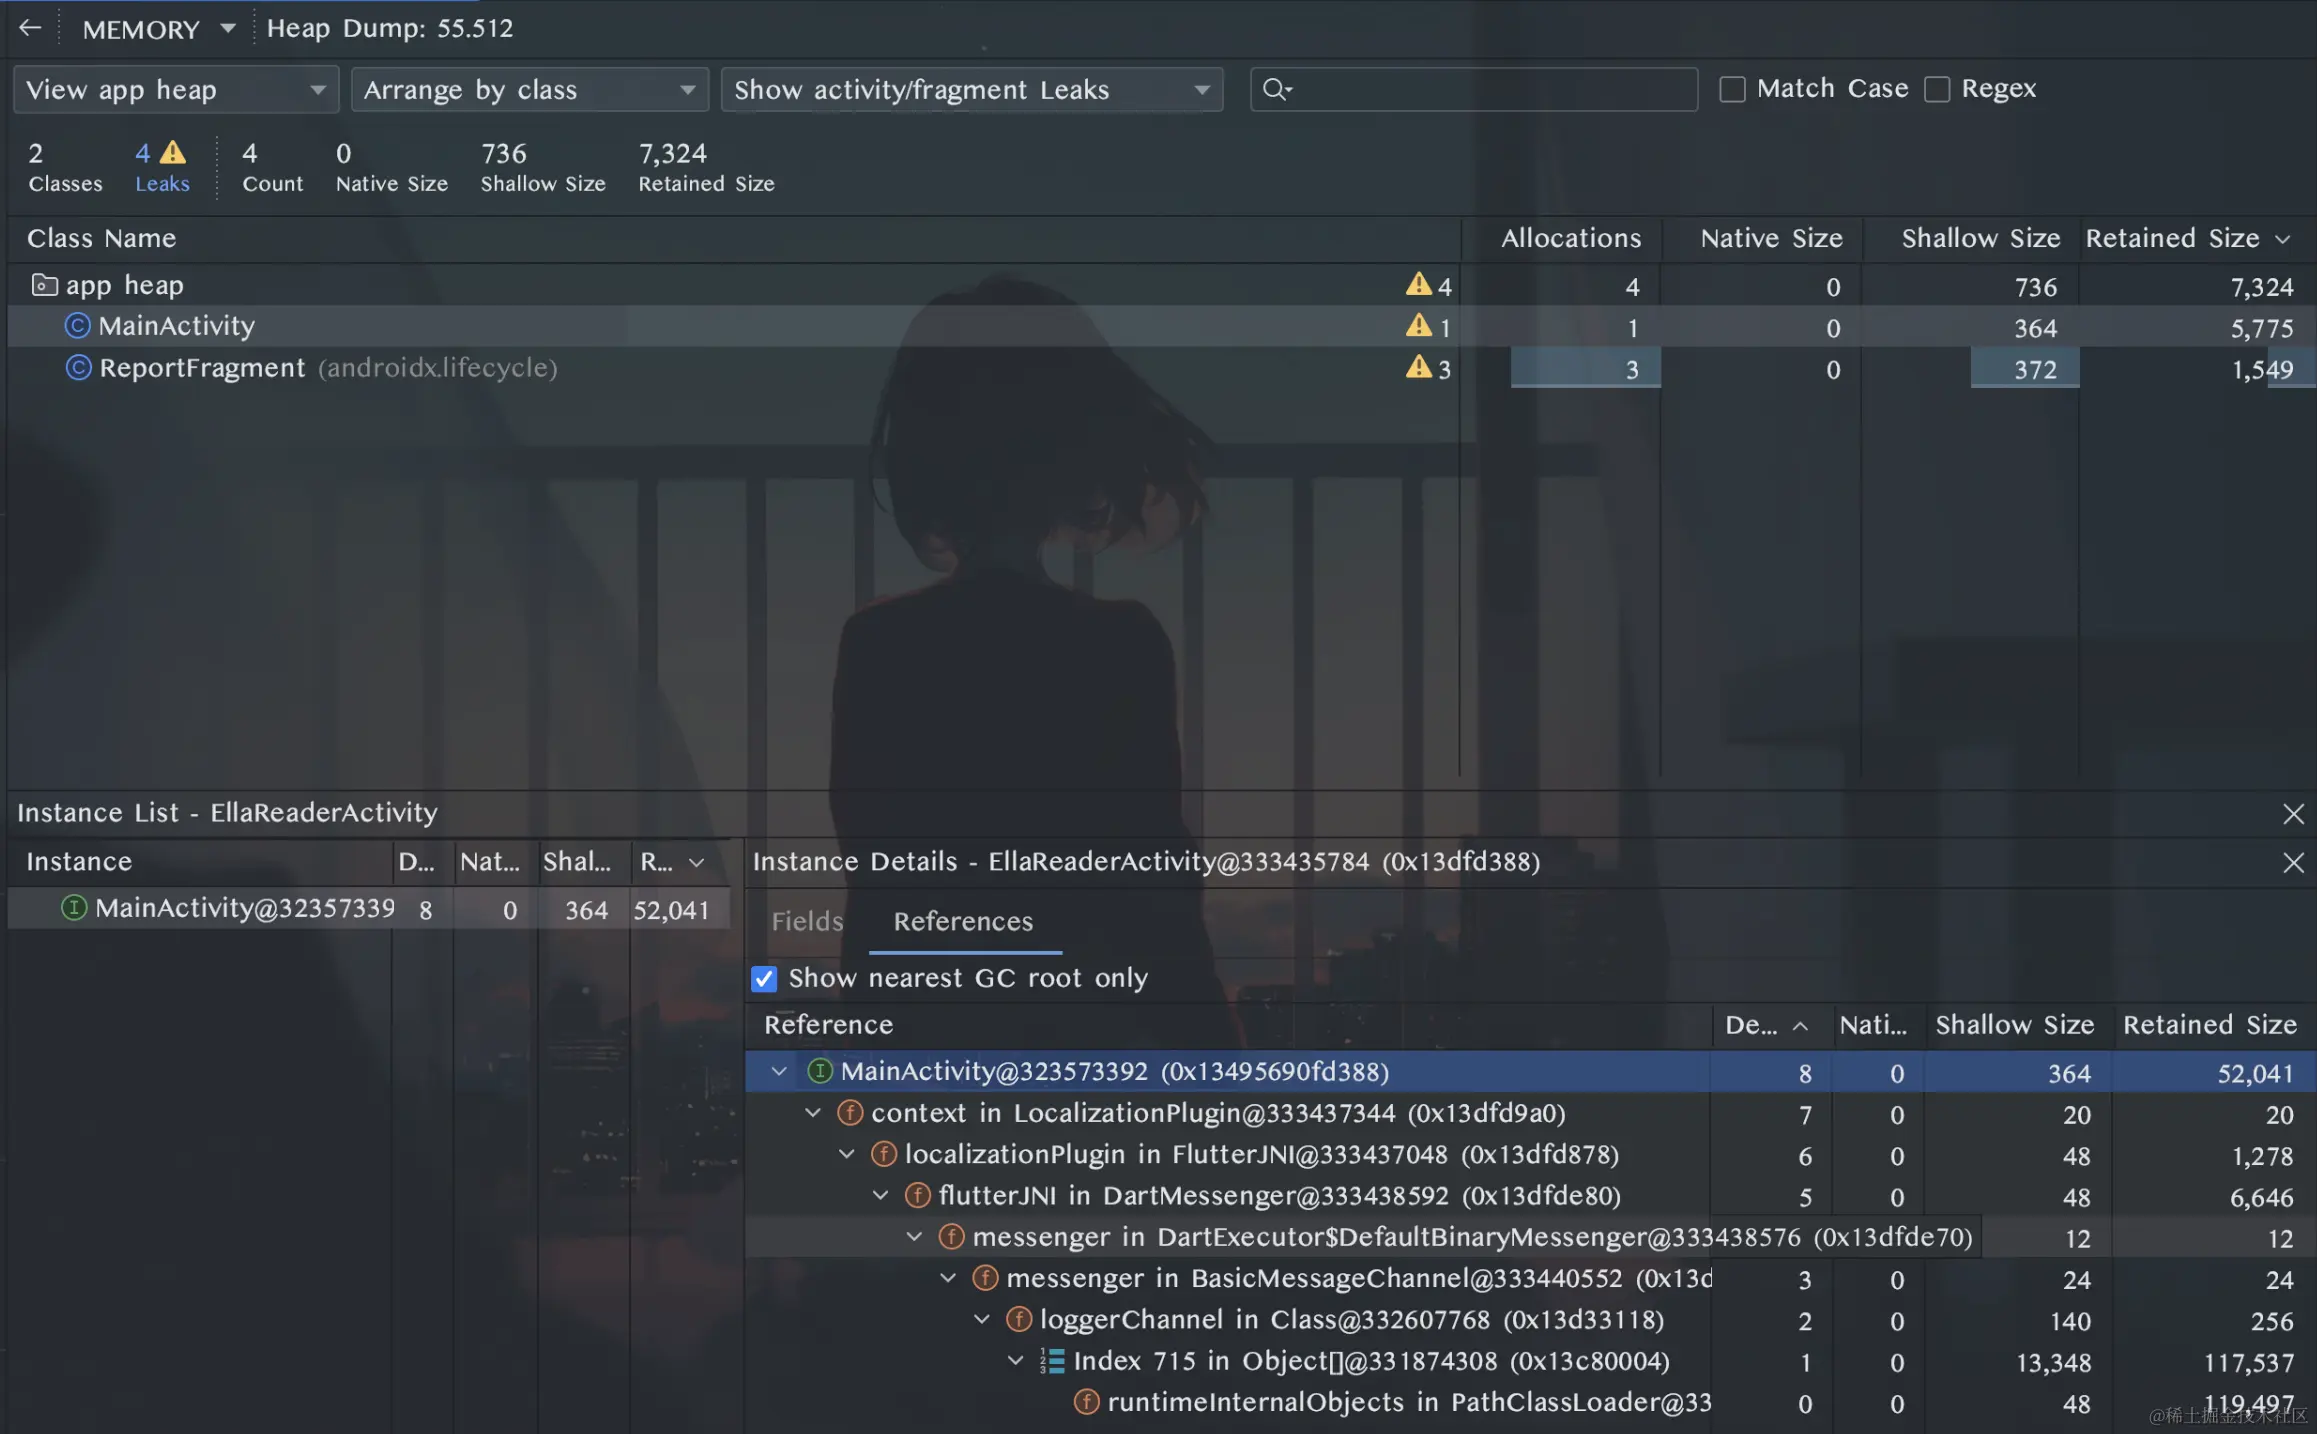
This activity is a secondary page that uses a multi-engine solution with a FlutterView running on it. It looks like a "single instance" memory leak, that is, no matter how many times you open and close, only one instance of the Activity will be retained in the heap and cannot be released. Common scenarios are global static variable references. This kind of memory leak has a slightly lighter impact on memory than multi-instance leaks, but if the memory footprint of this Activity is large, holding a lot of Fragments, Views, etc., it should still be optimized.
Judging from the reference chain, this memory leak was caused by a communication Channel inside FlutterEngine. When FlutterEngine is created, each plugin in the engine will create its own MessageChannel and register it to FlutterEngine.dartExecutor.binaryMessenger so that each plugin can communicate independently with Native.
For example, the writing of an ordinary plugin might look like this:
class XXPlugin: FlutterPlugin {
    private val mChannel: BasicMessageChannel<Any>? = null

    override fun onAttachedToEngine(@NonNull flutterPluginBinding: FlutterPlugin.FlutterPluginBinding) { // Callback when engine is created
        mChannel = BasicMessageChannel(flutterPluginBinding.flutterEngine.dartExecutor.binaryMessenger, CHANNEL_NAME, JSONMessageCodec.INSTANCE)
        mChannel?.setMessageHandler { message, reply ->
            ...
        }
    }

    override fun onDetachedFromEngine(@NonNull binding: FlutterPlugin.FlutterPluginBinding) { // Callback when engine is destroyed
        mChannel?.setMessageHandler(null)
        mChannel = null
    }
}
It can be seen that FlutterPlugin actually holds a reference to binaryMessenger, and binaryMessenger in turn holds a reference to FlutterJNI... This series of reference chains will eventually cause FlutterPlugin to hold Context, so if the plugin does not correctly release references, memory leaks will inevitably occur.
Let's look at the writing of loggerChannel in the reference chain in the figure above:
class LoggerPlugin: FlutterPlugin {
    override fun onAttachedToEngine(flutterPluginBinding: FlutterPlugin.FlutterPluginBinding) {
        LoggerChannelImpl.init(flutterPluginBinding.getFlutterEngine())
    }

    override fun onDetachedFromEngine(binding: FlutterPlugin.FlutterPluginBinding) {
    }
}

object LoggerChannelImpl { // This is a singleton
    private var loggerChannel: BasicMessageChannel<Any>?= null

    fun init(flutterEngine: FlutterEngine) {
        loggerChannel = BasicMessageChannel(flutterEngine.dartExecutor.binaryMessenger, LOGGER_CHANNEL, JSONMessageCodec.INSTANCE)
        loggerChannel?.setMessageHandler { messageJO, reply ->
            ...
        }
    }
}
In LoggerPlugin.onAttachedToEngine, FlutterEngine is passed to the singleton LoggerChannelImpl. binaryMessenger is held by the singleton, and the onDetachedFromEngine method does not perform destruction operations, so it is always referenced by the singleton, and the context cannot be released, causing memory leaks.
This plugin may not have considered the multi-engine scenario when designed. In the single engine scenario, the onAttachedToEngine and onDetachedFromEngine of the plugin are essentially following the lifecycle of the application, so memory leaks will not occur. But in multi-engine scenarios, DartVM will allocate isolates for each engine, which is somewhat similar to processes. The Dart heap memory of isolates is completely independent, so no objects (including static objects) are shared between engines. Therefore, FlutterEngine will create its own FlutterPlugin instances in its own isolate, which means the plugin lifecycle will be rerun every time an engine is created. When an engine is destroyed, if the plugin does not properly recycle and does not release related references to Context and FlutterEngine in time, memory leaks will occur.
Solutions:
LoggerChannelImpldoes not need to use singleton writing. Replace it with a normal class to ensure that theMessageChannelof each engine is independent.LoggerPlugin.onDetachedFromEngineneeds to destroy and nullify theMessageChannel.
Case 3: Third party library Native references memory leak
A third-party reader SDK was introduced into the project. During a memory analysis, it was found that each time the reader was opened, the memory would rise by a section and could not decrease. From the heap dump file, Profiler did not indicate that there were memory leaks in the project, but it could be seen that there were a very large number of unrecycled instances of an Activity in the app heap, with relatively large memory footprint.
Viewing the GCRoot References, it was found that these Activities were not referenced by any known GCRoots:
There is no doubt that this Activity has a memory leak, because during operation all related pages have been finished and GC was manually triggered. So the only possibility is that the Activity is referenced by some invisible GCRoot.
In fact, the Heap Dump of Profiler only shows the GCRoots in the Java heap, while the GCRoots in the Native heap are not displayed in this reference list. So, is it possible that this Activity is held by a Native object?
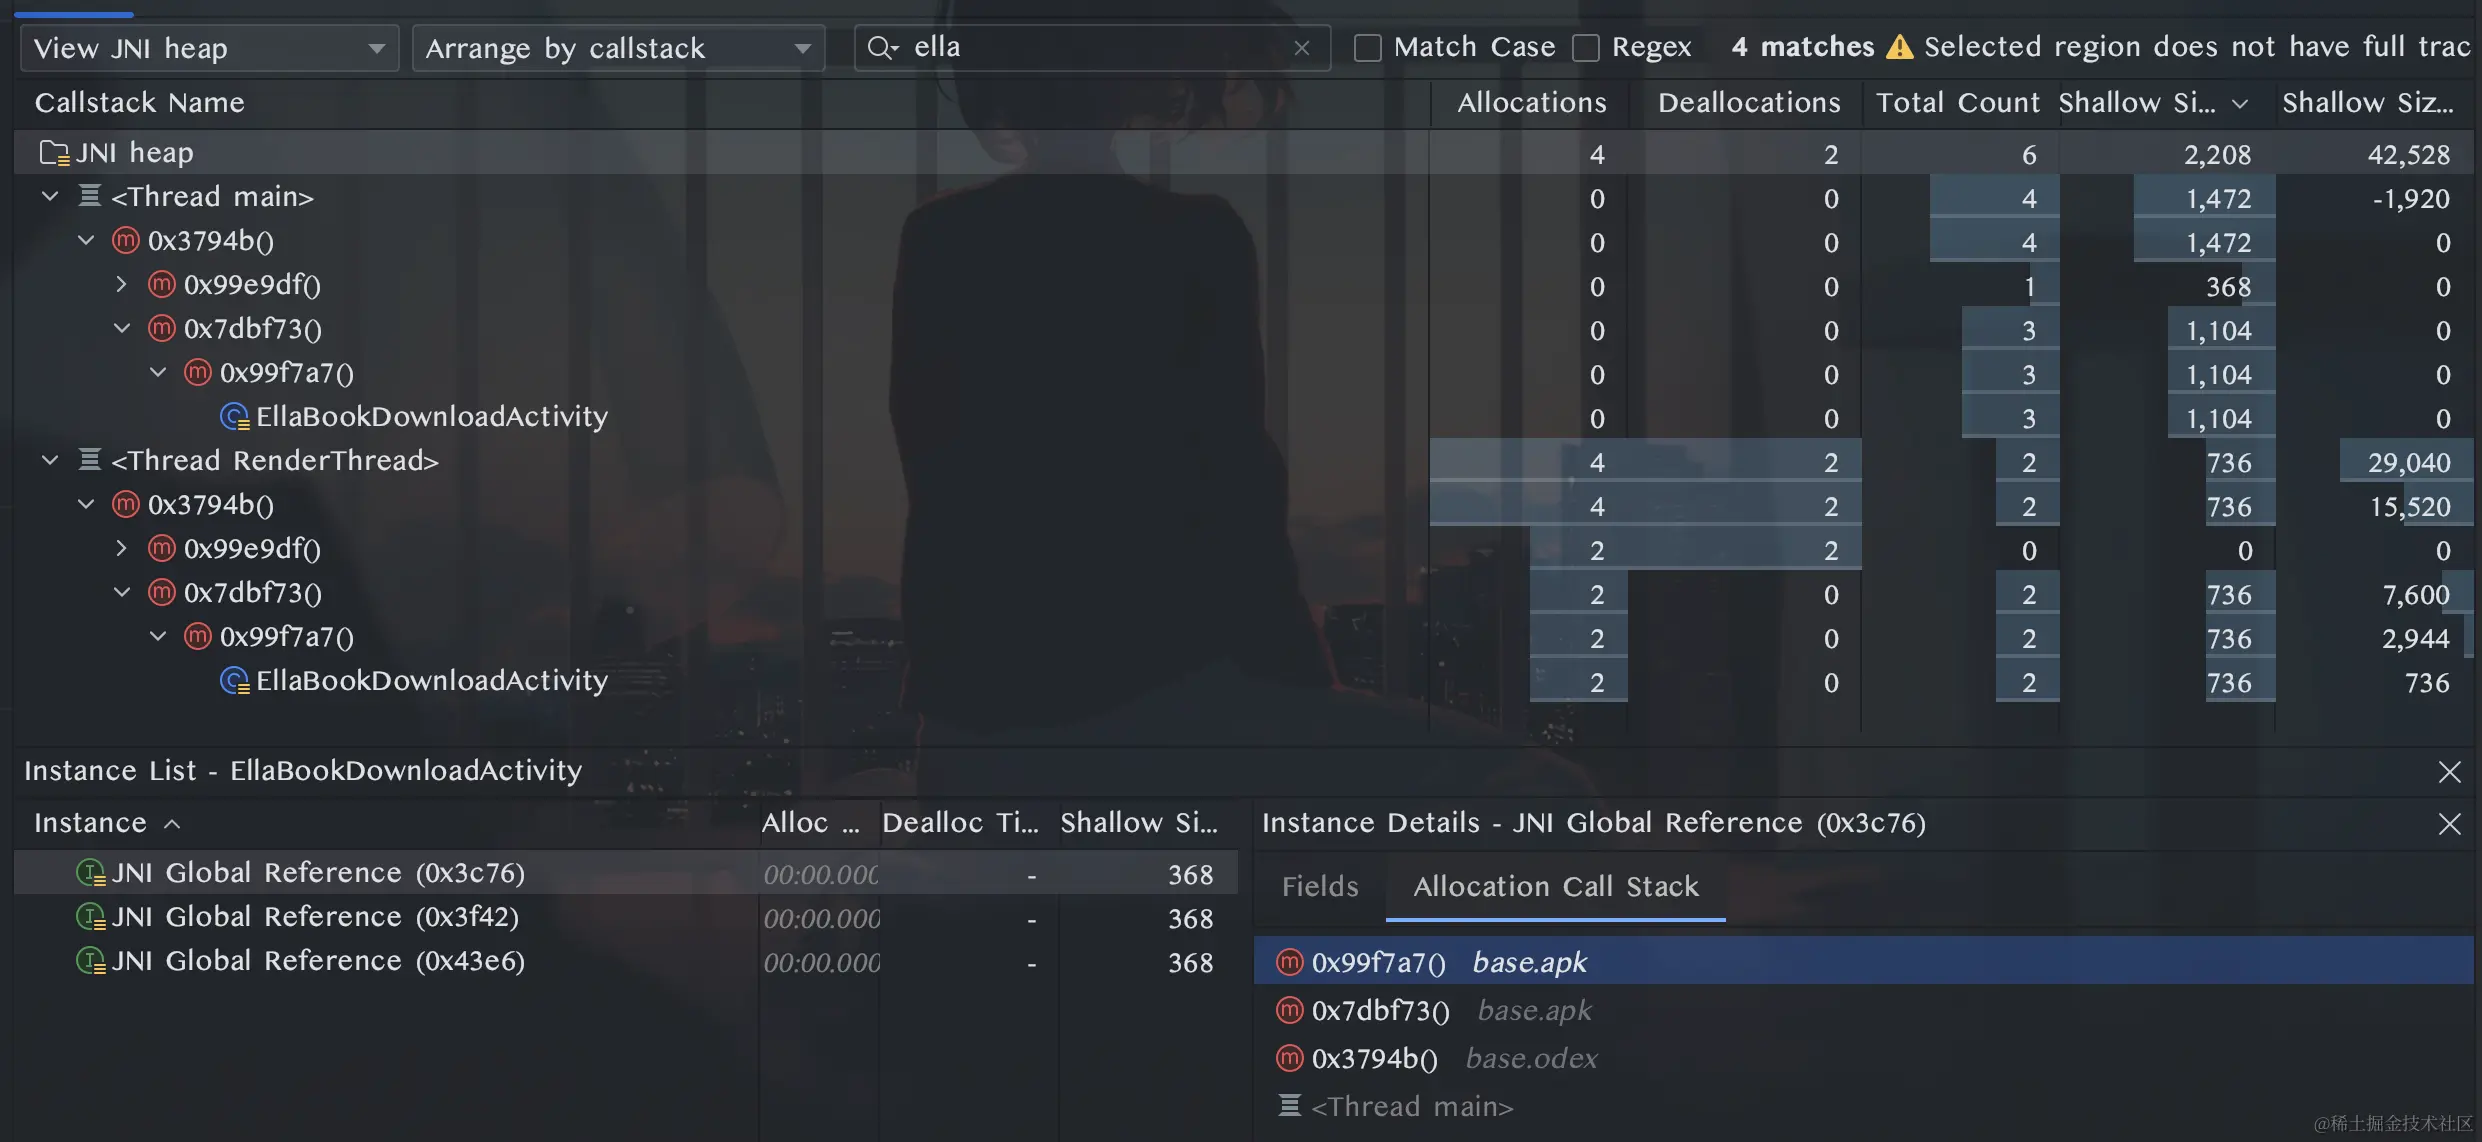
We used the dynamic analysis tool Allocations Record to look at the Activity's references in the Native heap, and indeed found some of its reference chains:

Unfortunately, the reference chains are all memory addresses without class names, so there is no way to know where the Activity is referenced. Later LeakCanary was tried, and although it also clearly stated that the memory leak was caused by Native layer Global Variable references, it still did not provide specific call locations.

We had no choice but to go back to the source code for analysis of possible call sites. This DownloadActivity is a book download page we made to adapt the reader SDK. When there is no local book, it will first download the book file, then pass it into the SDK to open the SDK's own Activity. So the function of DownloadActivity is to download, verify, unzip books, and handle some of the SDK reader's startup processes.
Following common logic, first check the download, verification, unzip code, and did not find any clues, listeners, etc. are weakly referenced; so it is inferred that it is the writing of the SDK itself that caused the memory leak.
It was found that when the reader SDK starts, there is a context parameter:
class DownloadActivity {
   ...
    private fun openBook() {
       ...
        ReaderApi.getInstance().startReader(this, bookInfo)
    }
}
Since the SDK's source code is all obfuscated, we can only hard decode the call chain starting from startReader:
class ReaderApi: void startReader(Activity context, BookInfo bookInfo)
        ↓
class AppExecutor: void a(Runnable var1)
        ↓
class ReaderUtils: static void a(Activity var0, BookViewerCallback var1, Bundle var2)
        ↓
class BookViewer: static void a(Context var0, AssetManager var1)
        ↓
class NativeCpp: static native void initJNI(Context var0, AssetManager var1);
Finally to the initJNI method of NativeCpp class, we can see that our Activity is passed in, subsequent processing is unknown, but based on the above memory analysis we can basically determine that it is because of this method that the reference to Activity is held by longer-lived Native objects, resulting in Activity memory leaks.
As for why Native needs context, there is no way to analyze it. We can only report this issue to the SDK vendor for further processing. The solutions are not difficult:
- Clear the Activity reference when destroying the reader in time;
- The
startReadermethod does not need to specify the Activity object. Changing the parameter declaration to Context is enough. The external can pass in theApplication Context.
Comments